BIRT Report Crosstab Element Tutorial
We cannot predict the number of records available in a database table. To display it in a BIRT report, we have to generate the table dynamically. BIRT report tables help achieve this for dynamic rows.
Why crosstabs are powerful
Crosstabs are ideal when you need to summarize data across two dimensions, such as students by course or sales by region and month. Instead of manually building dynamic columns, BIRT’s crosstab element lets you create matrix reports that adapt to your data automatically.
In this tutorial, the goal is to help you understand how data sets, data cubes, and bindings work together. Once you grasp these three pieces, you can build highly flexible reports that scale with your data.
But what if we want to generate a table with dynamic columns? With the BIRT report Crosstab element, we can generate both columns and rows dynamically.
What is a Crosstab?
A crosstab presents data in a matrix format and summarizes it in a compact way. It aggregates data by column and row groups. Common aggregations include sum, max, min, first, etc.
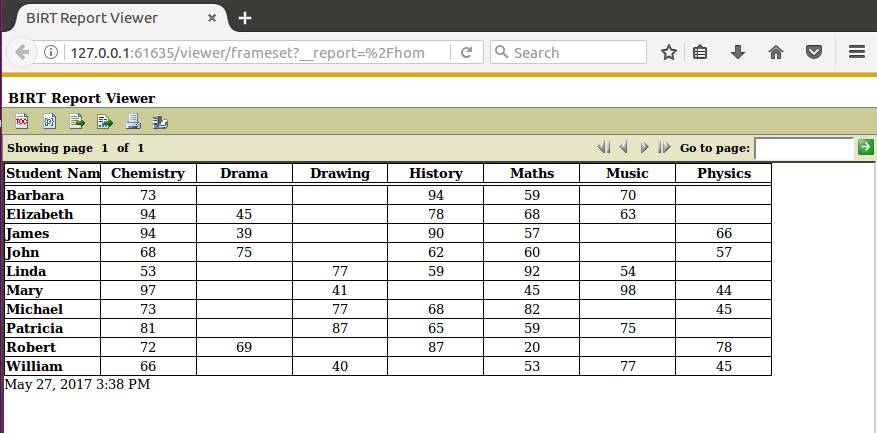
The Output
This is what we aim to achieve in this tutorial:
Initial Data Set
This is the raw data we are working with:
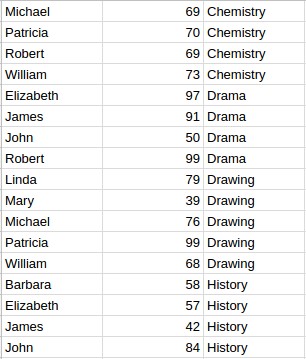
You can download the sample data set here.
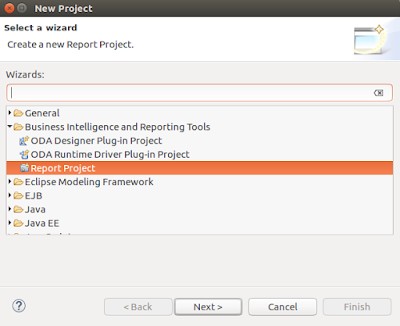
1. Create a BIRT Report Project
Go to File > New > Project > Report Project. Name it "Birt-Tutorial".
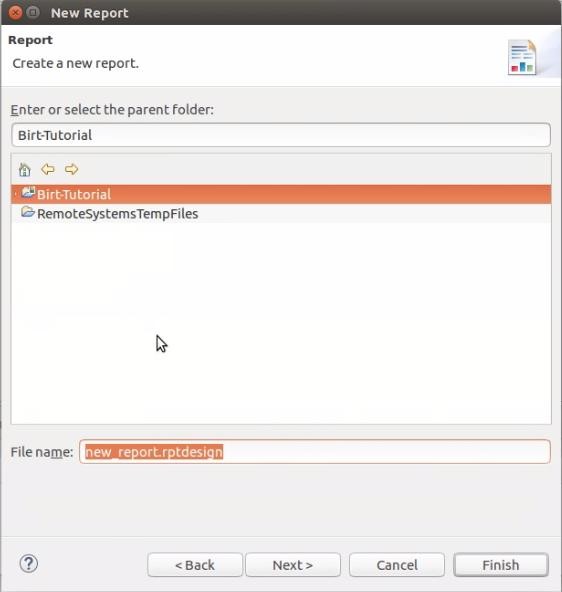
2. Create a Report Design File
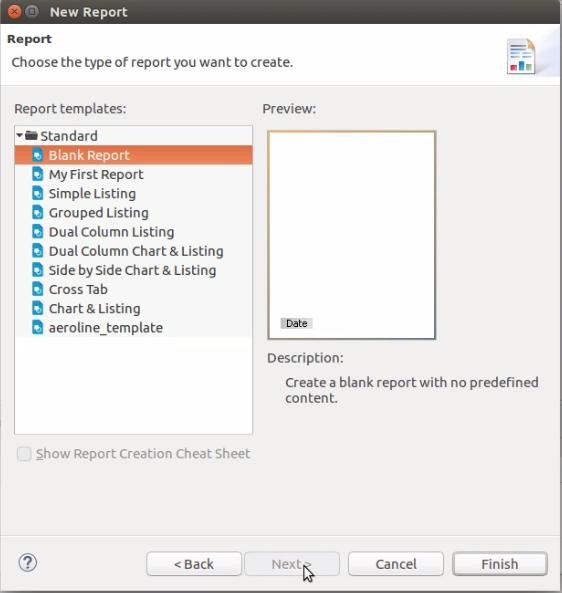
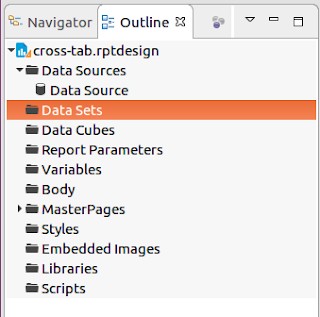
Go to File > New > Report. Name it `cross-tab.rptdesign` and choose a Blank Report template.
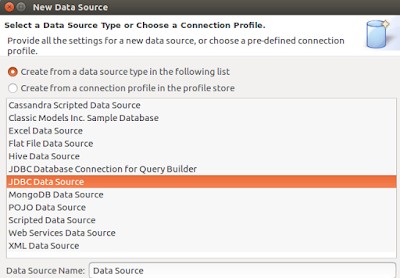
3. Create Data Source
In the Outline palette, right-click on Data Sources > New Data Source. Choose JDBC Data Source.

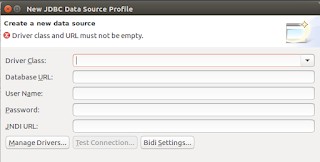
Provide your database connection details:
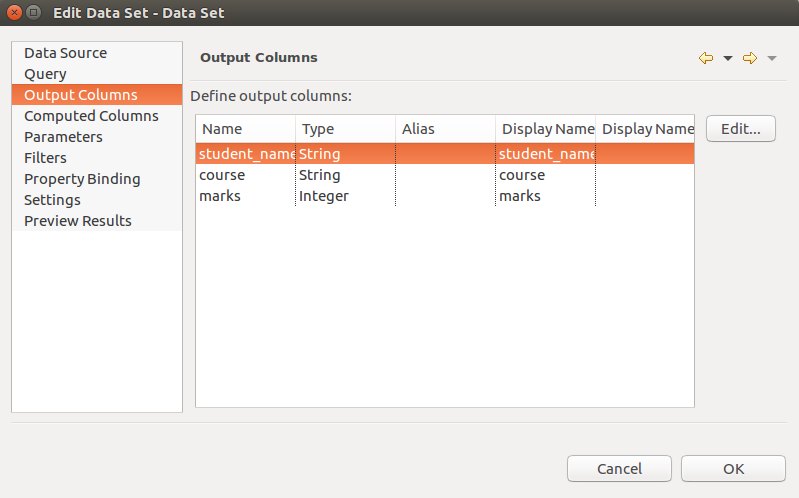
4. Create Data Set
Right-click on Data Sets > New Data Set.

Enter your SQL query to extract data:

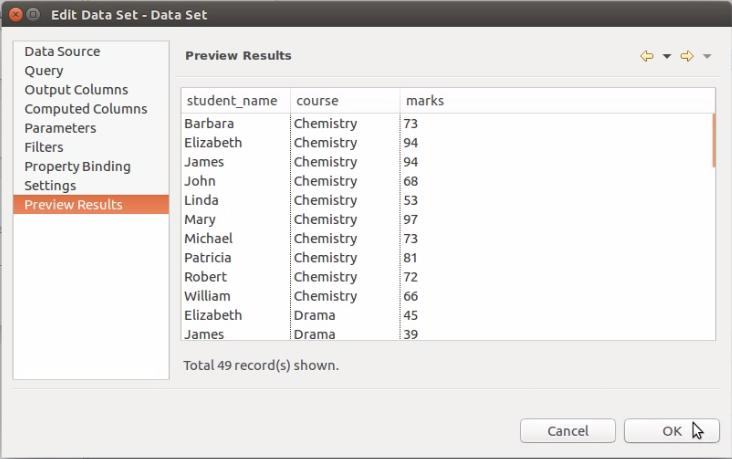
Preview the data to ensure it's correct:
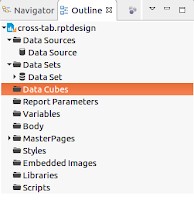
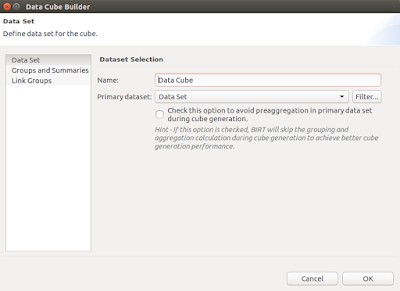
5. Create a Data Cube
A data cube is a multidimensional data structure. BIRT crosstabs rely on data cubes. Right-click on Data Cubes > New Data Cube.
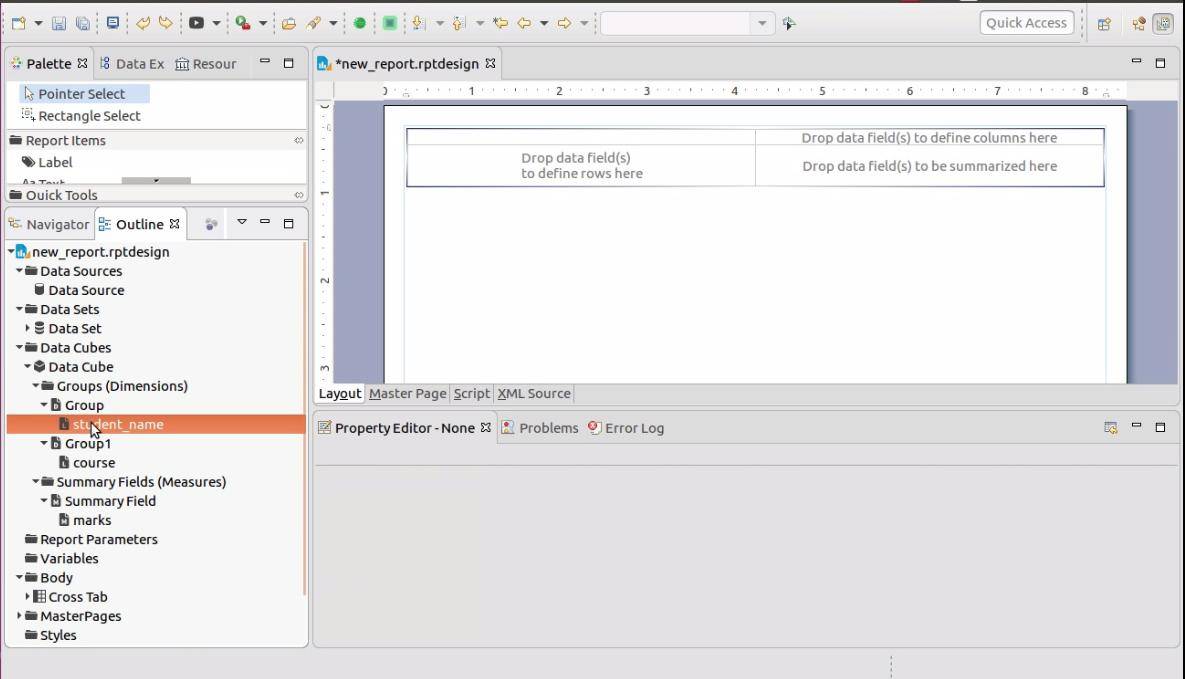
6. Define Groups and Summaries
Drag your fields into Groups and Summaries.
- Data Groups (Dimensions): Fields that define row keys (e.g., Student Name) and column keys (e.g., Course).
- Summary Fields (Measures): The values to display in the cells (e.g., Marks).
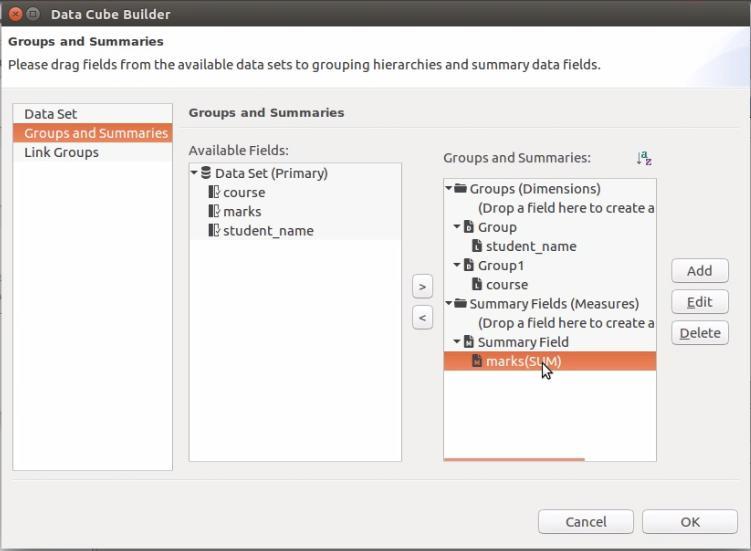
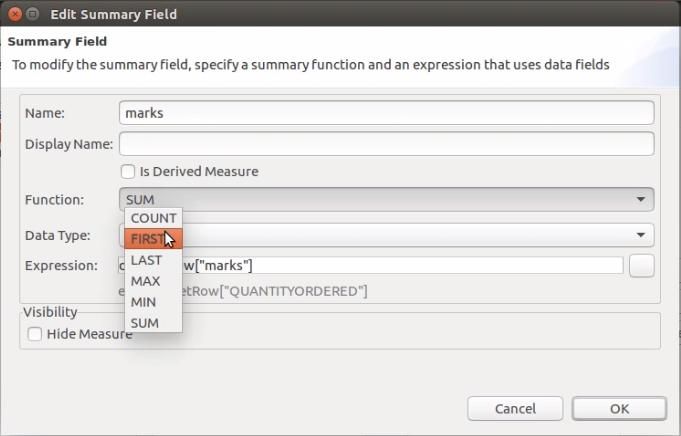
By default, the summary function is SUM. Since we have unique values per student/course, change this to FIRST by double-clicking the summary field.
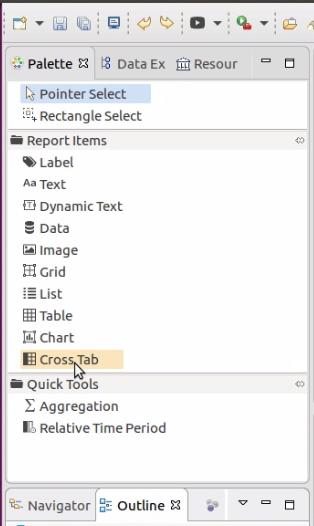
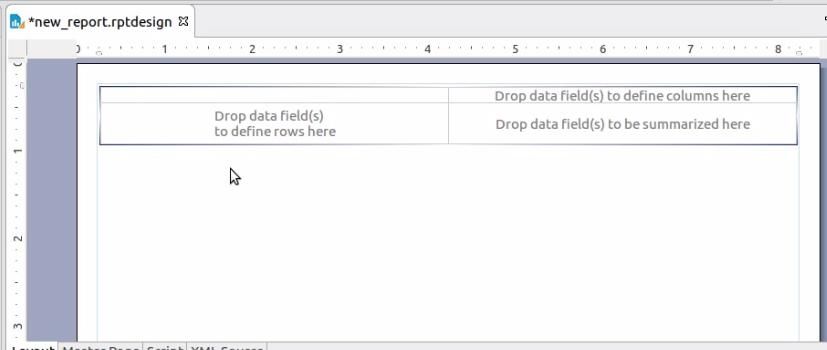
7. Add Crosstab to Report
Drag the Crosstab element from the Palette to your report layout.
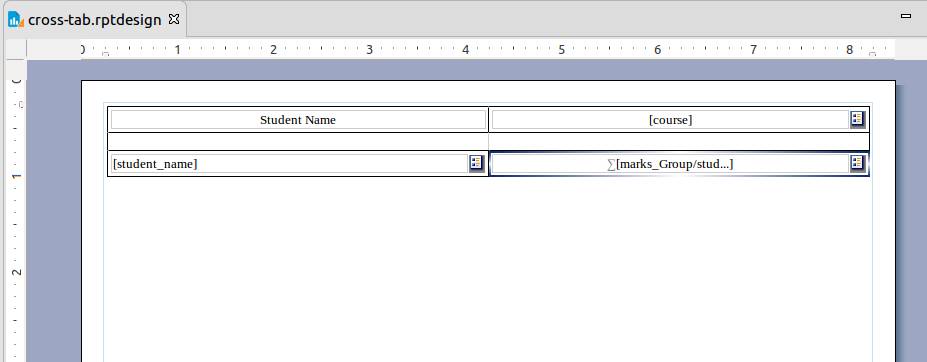
8. Bind Data
Drag your Groups and Summaries from the Data Explorer into the Crosstab layout (Rows, Columns, and Detail areas).
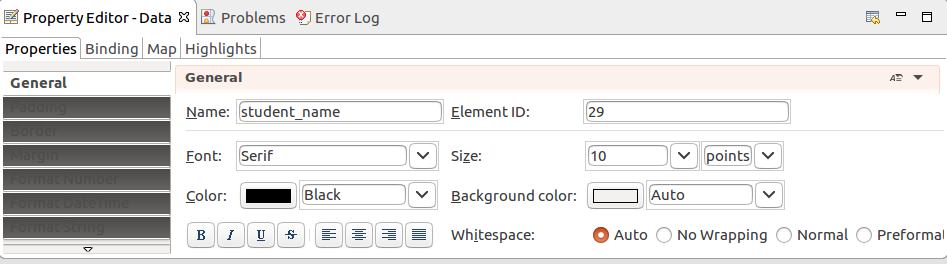
9. Styling and Preview
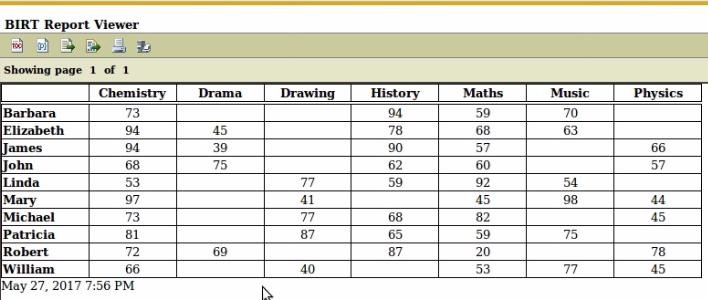
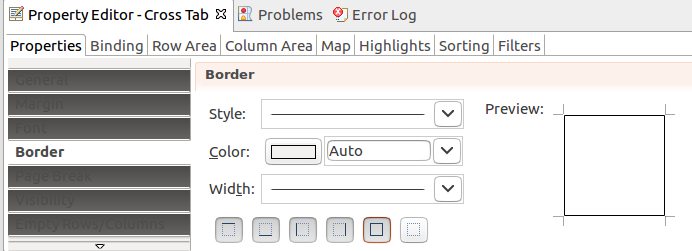
Add borders and text styles using the Property Editor.
Final Preview: